What is counted, what is excluded, and why its impact is systematically underestimated
Total U.S. healthcare spending in 2023 was approximately $4.9 trillion, or 17.6 percent of GDP, according to the National Health Expenditure Accounts maintained by the Centers for Medicare & Medicaid Services (CMS). These accounts define what is included in official healthcare spending. They do not publish a category labeled “healthcare administration.”
This omission reflects the fact that administrative work is embedded across insurers, contractors, providers, and clinicians’ time rather than reported as a discrete line item.
How administrative costs are treated in federal accounting
The National Health Expenditure Accounts are organized by type of service, not by internal function. As a result, administrative activity is distributed across multiple categories rather than consolidated.
Hospital billing offices, compliance departments, revenue-cycle teams, and quality-reporting staff are counted under hospital care.
Physician practice billing, documentation support, and compliance staff are counted under physician and clinical services.
Insurance overhead is reported separately as the net cost of private health insurance.
Public program administration is reported narrowly through budgetary and trust-fund accounting.
Time spent by clinicians on documentation, billing, prior authorization, and compliance is not reported as spending at all.
Administrative work therefore exists throughout the system but is fragmented in reporting and partially invisible in aggregate statistics.
📊 FIGURE 1 —
If CMS doesn’t list admin costs, where are they?
Administrative work in U.S. healthcare is not missing; it is distributed across insurers, contractors, providers, and clinicians’ time. Federal accounting captures only select components as “administration,” while substantial administrative activity is embedded in clinical spending or excluded entirely when it takes the form of time rather than dollars.
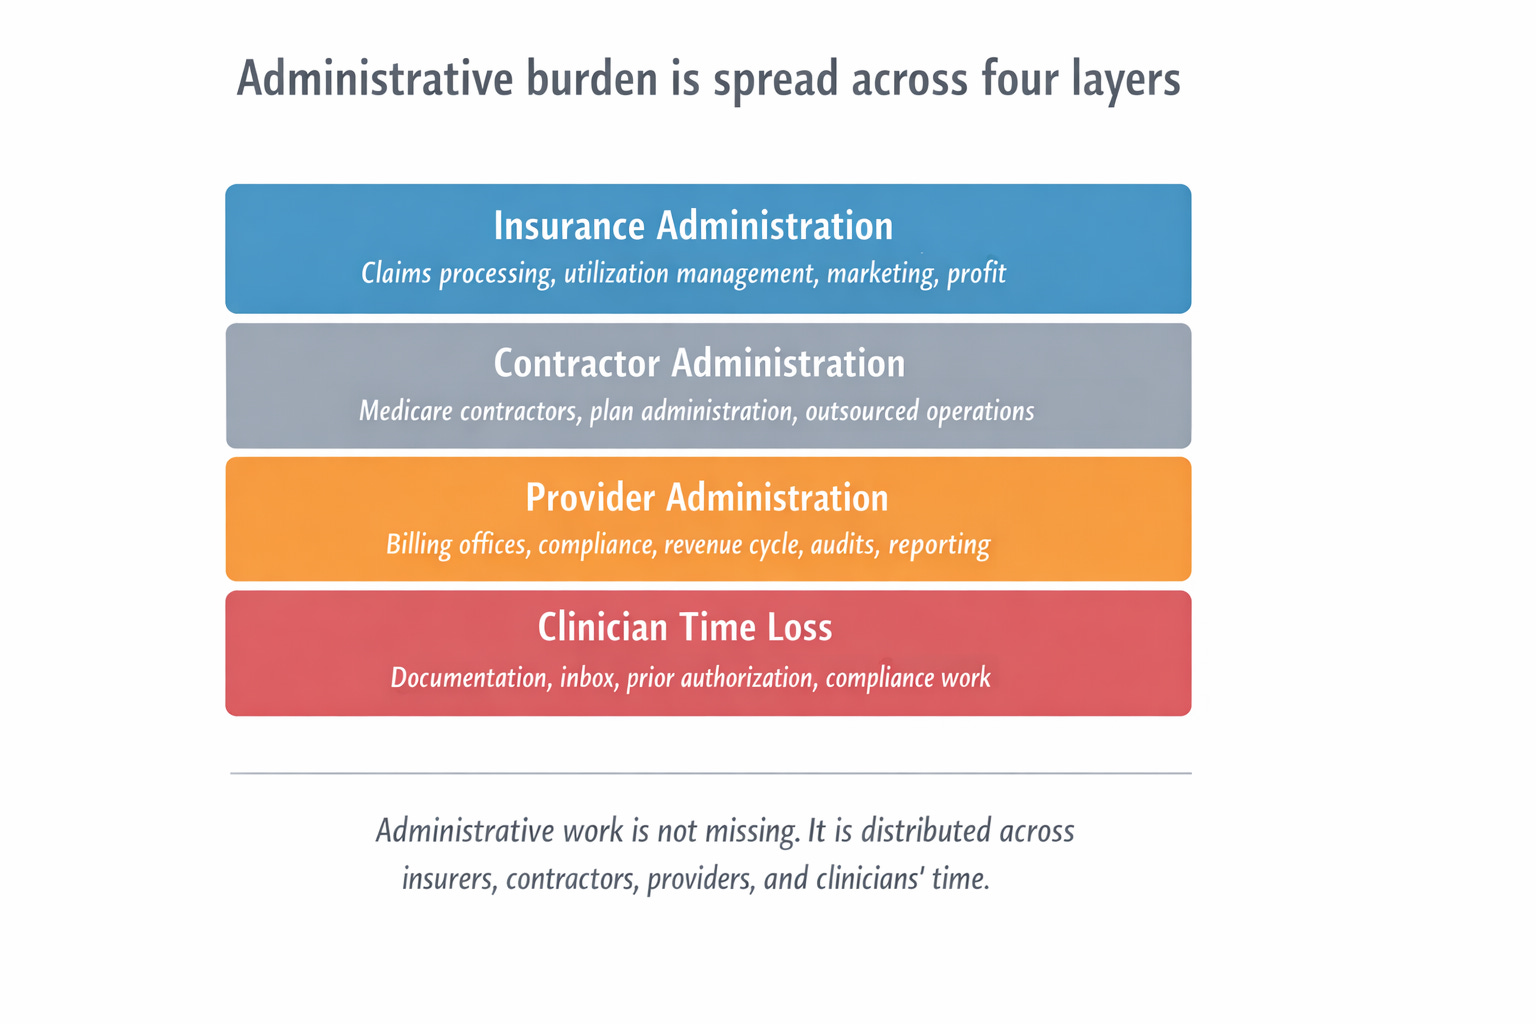
The layered structure of healthcare administration
Administrative burden in U.S. healthcare operates through distinct layers, each with different visibility in accounting and different implications for access.
Layer 1 includes explicit insurance and program administration.
Layer 2 includes contractor-mediated administration, particularly in Medicare.
Layer 3 includes provider-side administrative expense embedded in hospitals and practices.
Layer 4 includes administrative burden as lost clinical capacity.
Failure to distinguish among these layers leads to systematic underestimation.
📊 FIGURE 2 —
Administrative work is embedded, not missing
(Administrative activity inside “clinical” spending)
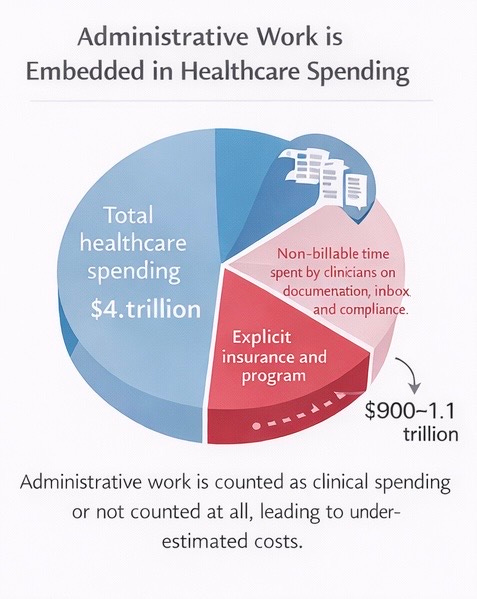
Administrative activity is frequently counted as clinical spending or not counted at all. Provider billing, compliance, and reporting costs are embedded within hospital and physician service categories, while clinician documentation time is excluded from spending totals, leading to systematic underestimation.
What is known about administrative spending
Using conservative, peer-reviewed definitions that include explicit insurance and program administration, national estimates place administrative spending alone at approximately $900 billion to $1.1 trillion per year, or roughly 15–25% of total healthcare spending, depending on definition and year.
These figures exclude clinician time spent on non-clinical work and therefore represent lower bounds, not comprehensive totals.
Provider-side administrative expense is substantial
Hospitals and physician practices maintain extensive administrative infrastructure to meet billing, documentation, audit, contracting, and quality-reporting requirements.
Practice-level studies estimate that interactions with health plans alone cost U.S. physician practices approximately $83,000 per physician per year, far exceeding comparable systems with simpler payment structures. These estimates do not include physician documentation time.
Federal accounting does not label these activities as administration. Their economic function is administrative regardless of classification.
📊 FIGURE 3 —
Long-term shift in healthcare spending distribution
(Cumulative change in administrative vs provider compensation categories)
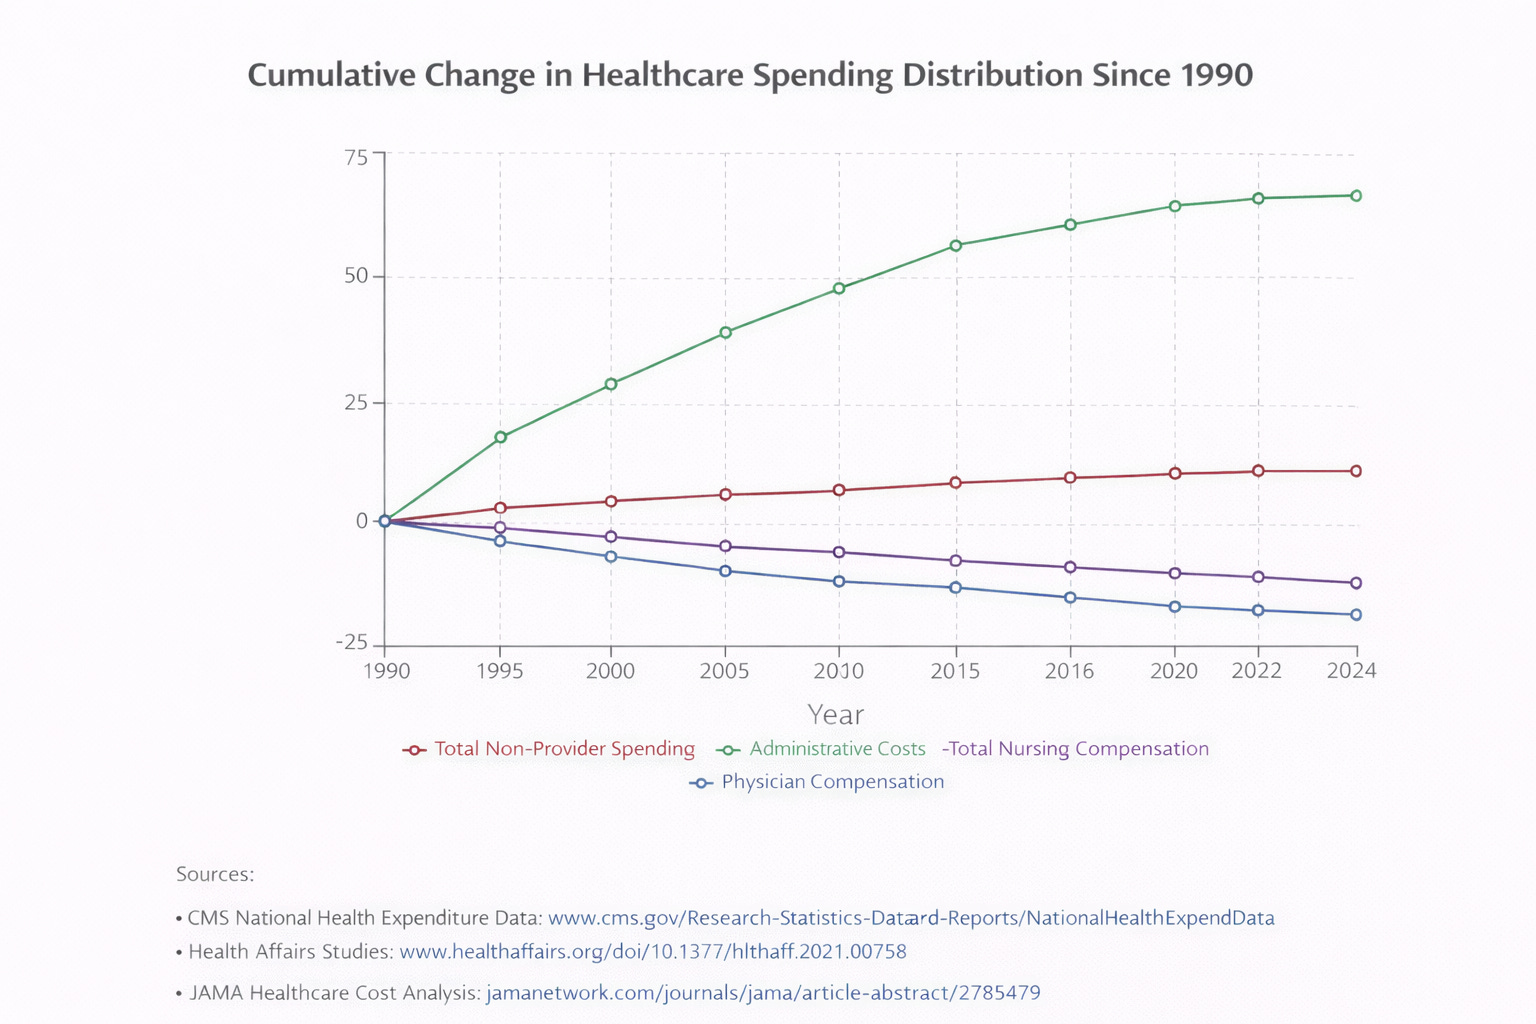
Over time, a growing share of healthcare spending has flowed toward administrative and non-provider categories, while physician compensation has grown more slowly. This reflects structural changes in system organization rather than changes in clinical complexity alone.
Administrative burden as lost clinical capacity
Administrative cost is not limited to spending. It also appears as time diverted from clinical work.
Studies using EHR audit logs and time-motion methods show that physicians spend several hours per workday on documentation, inbox management, and compliance-related tasks, much of it outside scheduled clinical hours.
These measurements are derived from production-system logs, not surveys.
Time spent on these activities displaces patient care. This displacement appears as fewer visits, reduced availability, and longer wait times.
📊 FIGURE 4 —
How administrative burden affects clinical time
(Shift from patient care to documentation and inbox work)
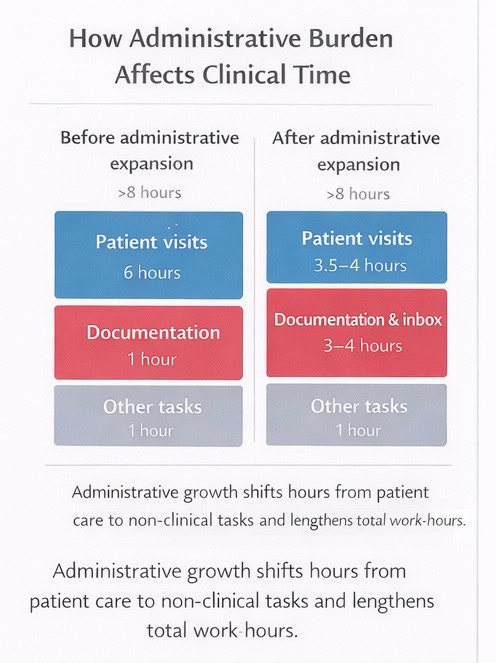
Administrative burden shifts time away from patient care toward documentation and inbox management and extends total work hours. Measured EHR audit-log studies show that non-clinical work increasingly occurs outside scheduled clinical hours rather than replacing them.
When measured documentation burden is converted conservatively into lost clinical capacity, the resulting capacity loss is on the order of tens of thousands of physician full-time equivalents nationally, comparable in scale to projected physician shortfalls over the coming decade.
Administrative burden and workforce contraction
Administrative burden affects healthcare capacity through more than visit displacement. It also contributes to workforce contraction.
As documentation and compliance requirements expand, physicians initially respond by extending workdays rather than reducing scheduled clinical time. Sustained non-clinical workload is strongly associated with burnout, reduced clinical effort, and exit from practice.
The first-order effect is reduced throughput. The second-order effect is fewer clinicians remaining in practice.
Medicare and administrative workload
Statements that Medicare’s administrative costs are approximately one to two percent refer only to direct program administration reported through trust-fund accounting.
That figure excludes contractor-mediated administration, Medicare Advantage plan-level administration and profit, provider-side compliance infrastructure, and documentation-related capacity loss.
📊 FIGURE 6 —
Why Medicare “looks” low admin
(Accounting scope vs actual workload)
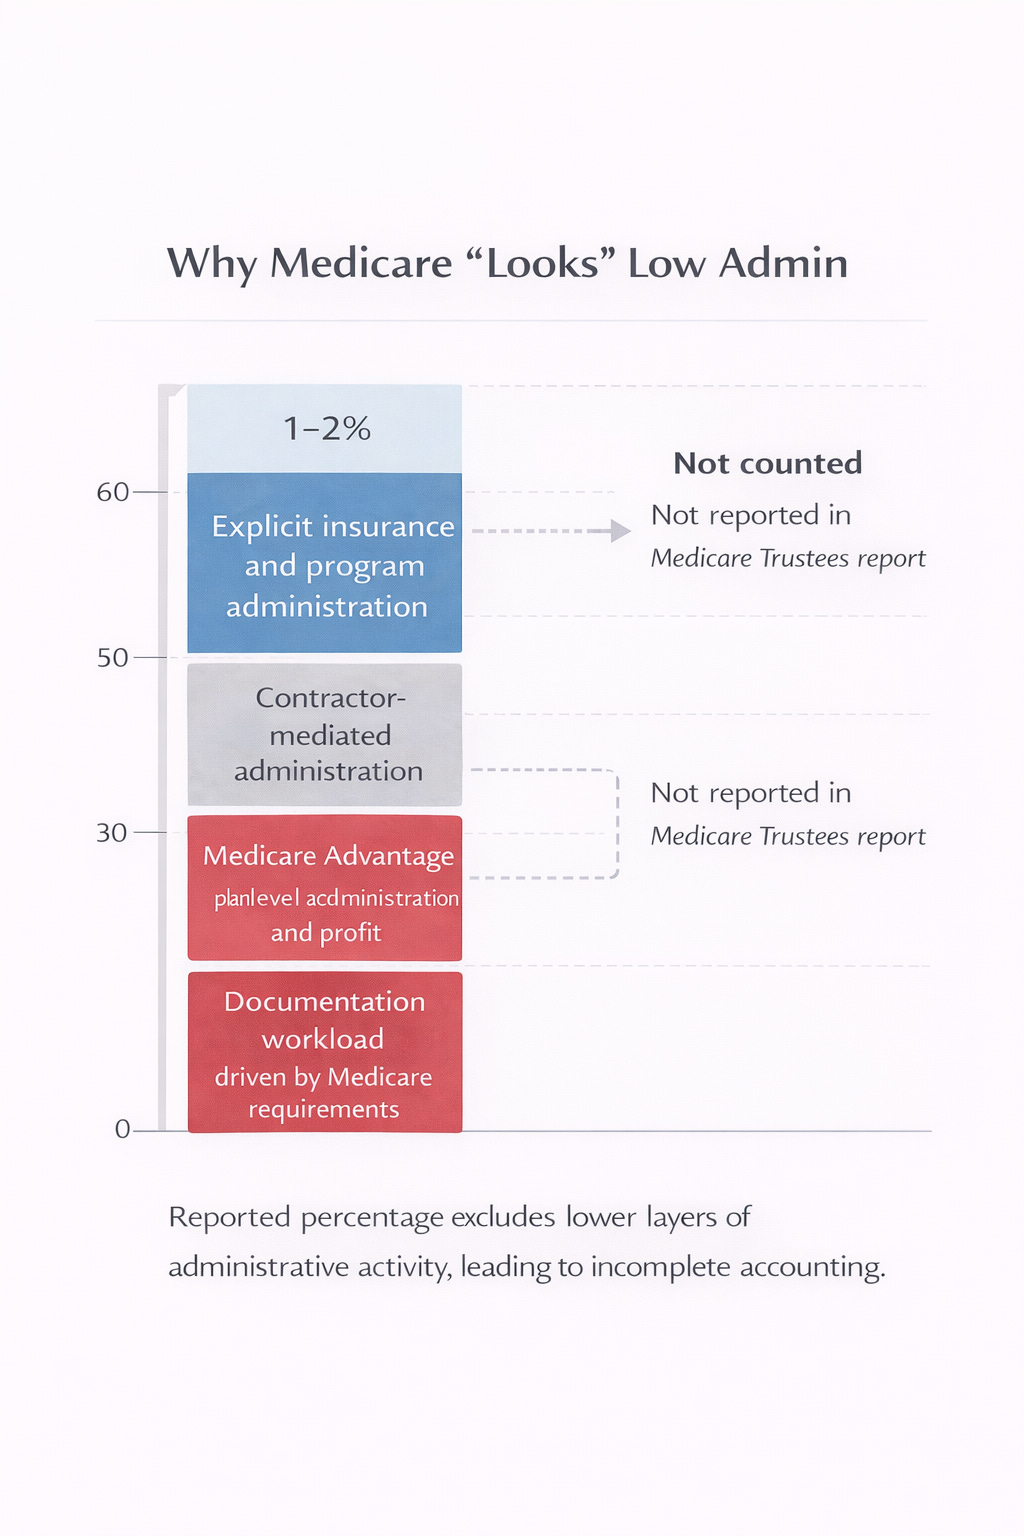
Medicare’s reported administrative cost reflects narrow trust-fund program administration only. Contractor operations, Medicare Advantage plan administration, provider compliance infrastructure, and documentation-related capacity loss are excluded from this figure, understating total administrative workload.
The economic impact and opportunity cost of administrative burden
Administrative burden reallocates labor and capital toward administrative activity and away from health-producing activity.
A comprehensive estimate placed U.S. administrative spending at $812 billion in 2017 (34.2% of NHE), substantially higher than peer systems using comparable definitions. This represents a large allocation of labor and capital to administration across insurers and providers.
Opportunity cost operates through two channels:
direct spending diverted from care delivery and capacity expansion, and
clinician time diverted from patient care, reducing productivity per unit labor input.
Cross-national comparisons show higher administrative intensity in the U.S. without commensurate outcome gains, indicating resource misallocation rather than value creation.
Conclusion
Administrative spending in U.S. healthcare is large.
Administrative burden further reduces access through lost clinical capacity.
Administrative cost concentrates in high-volume, lower-acuity care.
Administrative burden extends work hours, drives burnout, and contributes to workforce contraction.
Administrative expansion imposes a real economic opportunity cost through misallocation of labor and capital.
Federal accounting frameworks systematically understate total administrative impact.
Any assessment of healthcare cost, access, or workforce capacity that does not account for all administrative layers and their downstream effects is incomplete.
ENDNOTES
Centers for Medicare & Medicaid Services (CMS). National Health Expenditure Accounts, 2023 Highlights. Total spending $4.9T; 17.6% GDP.
CMS. Definitions, Sources, and Methods Used in the National Health Expenditure Accounts. Explains classification by service type rather than function.
CMS. Net Cost of Private Health Insurance – Quick Definitions. Defines insurer administrative spending category.
CMS. “What Is a Medicare Administrative Contractor?” Describes contractor-mediated administration in Medicare.
Sinsky C, et al. “Allocation of Physician Time in Ambulatory Practice.” Annals of Internal Medicine. Time-motion study showing high EHR and desk work share.
Agency for Healthcare Research and Quality (AHRQ). Measuring Documentation Burden in Healthcare: A Technical Brief. Validates EHR audit-log and time-motion methods.
Himmelstein DU, Woolhandler S, et al. “Health Care Administrative Costs in the United States and Canada, 2017.” Annals of Internal Medicine. U.S. administration $812B; 34.2% of NHE.
Casalino LP, et al. “What Does It Cost Physician Practices to Interact With Health Insurance Plans?” Health Affairs. National payer-interaction cost estimates.
Morra D, et al. “U.S. Physician Practices Versus Canadians.” Health Affairs. Estimates ~$82,975 per physician per year in payer interaction costs.
Arndt BG, et al. “Tethered to the EHR.” Annals of Family Medicine. EHR audit-log study documenting extensive after-hours work.
Murad MH, et al. “Measuring Documentation Burden in Healthcare.” Journal of General Internal Medicine. Systematic review of burden measurement methods.
Association of American Medical Colleges (AAMC). Physician Supply and Demand Projections, 2021–2036. Projected physician shortages.
Adler-Milstein J, et al. “Electronic Health Record Use and Burnout.” Journal of the American Medical Informatics Association. Links EHR workload to burnout components.
Shanafelt TD, et al. “Changes in Burnout and Satisfaction With Work–Life Integration.” Mayo Clinic Proceedings. National burnout trends and drivers.
Dyrbye LN, et al. “Physician Burnout and Its Associated Factors.” Journal of General Internal Medicine. Burnout associations with intent to reduce work or leave practice.
Medicare Payment Advisory Commission (MedPAC). Medicare Advantage Payment Basics. Confirms plan bids include administrative costs and profit.
Social Security Administration. Medicare Trustees Report. Defines scope of reported Medicare administrative costs.
No comments:
Post a Comment