Summary
The U.S. healthcare system is undergoing a significant transformation, shaped by shifting patterns in medicine use, evolving patient cost burdens, changing benefit designs, and rising spending driven by innovation. At the same time, structural barriers in access and affordability continue to present persistent challenges for patients, often leading to patients who may need medicines the most not receiving them. Together, these dynamics define a market that is expanding in complexity while also signaling important opportunities for system-level improvements. As discussions continue around access and affordability, policymakers, payers, and manufacturers have an opportunity to implement meaningful change to ensure the sustainability of the U.S. healthcare system and that patients are able to benefit from the full potential of medical advances.
Areas of focus in this year’s report range from looking at how medicine usage patterns have shifted, to the impact of out-of-pocket costs and benefit designs on patients, to the complex nature of drug pricing. Evolving trends in 2025 and recent policies have driven significant revisions to the outlook, and in this report, the drivers of change in medicine spending over the next five years are deconstructed to enable a better understanding. This examination includes the impact of novel obesity and diabetes medicines and the uptake of other innovative brands that are driving medicine spending.
Health Train Express reports on the IQVIA Institute symposia (online) on July 15,2026.
The complete report can be ACCESSED Here. (full disclosure, )
Key Findings
Medicine use has increased:
Total prescription medicine use increased 1.5%, reaching 210 billion days of therapy in 2025
Vaccinations have had mixed trends, with seasonal vaccines seeing significant declines in the latest season, while many routine vaccines increased in 2025
Some patients see out-of-pocket cost reductions:
Patient out-of-pocket costs reached a record $110Bn in 2025, increasing by $6Bn
Implementation of the Medicare Part D out-of-pocket cap reduced overall spending by Medicare beneficiaries, offset by increases in other pay types driven by GIP/GLP-1s
Patients continue to see barriers to medicine access:
Nearly two-thirds of prescriptions for newly launched drugs go unfilled in the first year on the market, and limited coverage persists for several years
Spending on medicines has accelerated:
The U.S. market at net prices grew 10.6% in 2025 and an average of 9.3% annually over the last five years
GIP/GLP-1 agonists and COVID-19 medicines have had significant impacts on spending growth since 2020
Growth will slow through 2030:
U.S. medicine spending at net prices is forecast to grow 4.5 to 7.5% through 2030, while 6 to 9% at list prices
Pricing pressures and patent expiries will slow growth through 2030 offset by continued uptake of innovative therapies
Other Findings
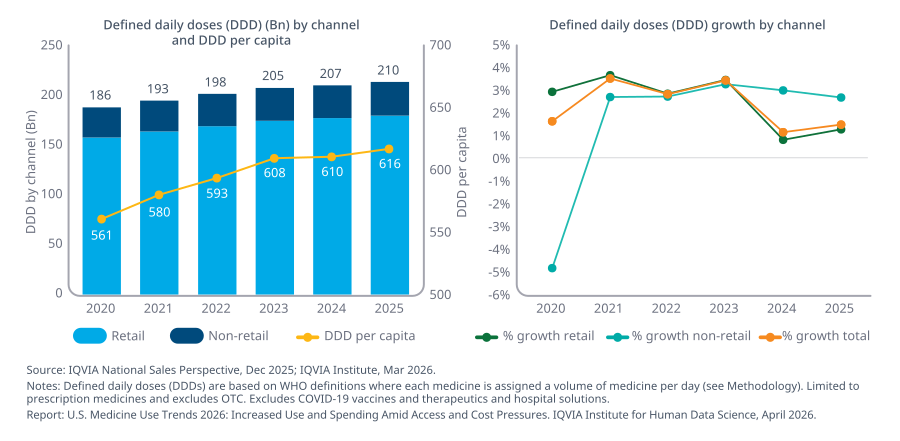
The use of prescription medicines in the U.S. — based on defined daily doses — has grown 13% in the last five years to 210 billion days of therapy across both retail and non‑retail settings, although growth slowed beginning in 2024.
Retail drugs currently represent 84% of medicine use in the U.S., with only 16% in non‑retail settings, and non‑retail growth exceeded retail growth in 2025.
The use of prescription drugs dispensed from retail pharmacies has continued to grow at an average annual rate of 2.4% over the last five years, with much slower growth in 2024 and 2025, reducing total market growth.
Out‑of‑pocket costs rose in aggregate for commercially insured patients, Medicaid beneficiaries, and those who paid cash, while Medicare out‑of‑pocket costs declined, largely driven by the Medicare Part D out‑of‑pocket cap implemented in 2025.
Commercial insurance out‑of‑pocket costs, which account for 52% of total patient out‑of‑pocket costs, rose 5% in aggregate in 2025 and 37% over five years due to increased volume and a shift towards higher‑cost prescriptions.
Medicare out‑of‑pocket costs declined by $638 million (2.2%) in aggregate in 2025 following the implementation of the Medicare Part D out‑of‑pocket cap; however, costs remain more than $5.3 billion (23%) higher than in 2020, driven by increased volume and shifts in prescription mix.
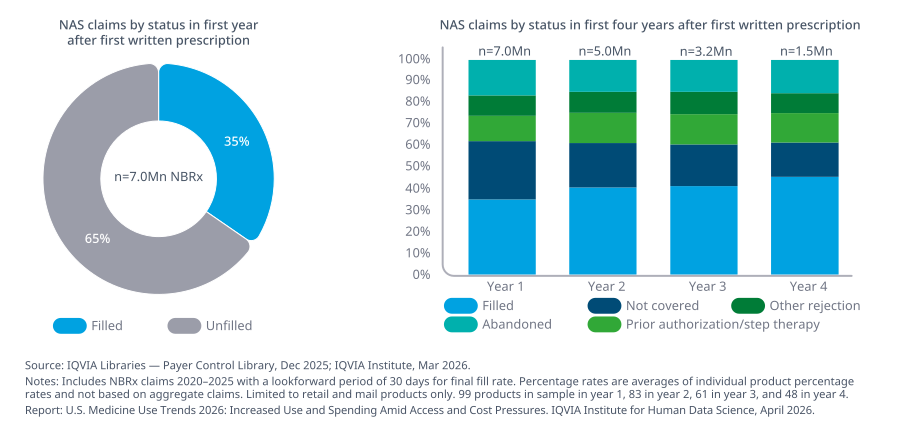
Between 2020 and 2024, 99 novel medicines were launched in retail and mail channels in the U.S., often providing benefits over standard of care or addressing unmet needs. For these medicines, 7 million new prescriptions were written in the first year of availability, with 64% related to RSV vaccines alone.
On average, 35% of these prescriptions were filled, while 65% went unfilled, including an average of 49% rejected by payers and 17% abandoned by patients after payer approval, likely due to high out‑of‑pocket costs.
During the first four years a new medicine is on the market, fill rates improve; however, by year four, more than half of new prescriptions still go unfilled, significantly higher than the 29% unfilled rate across all brands and branded generics.
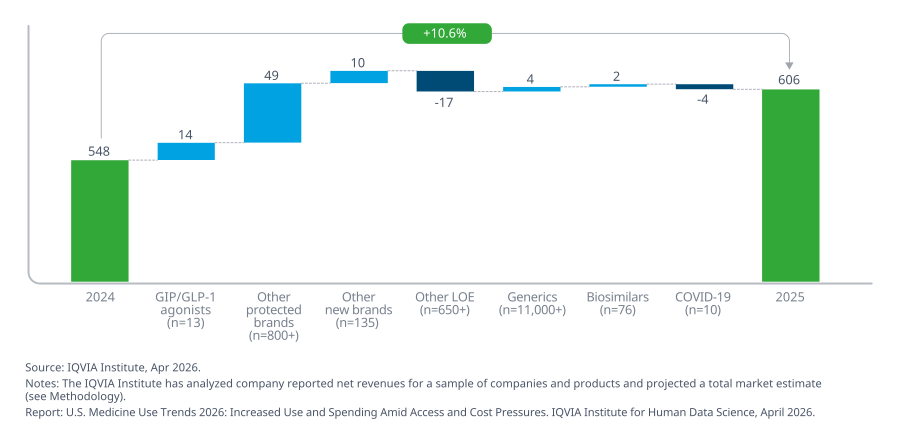
Net medicine spending increased by $58 billion (10.6%) in aggregate, rising from $548 billion in 2024 to $606 billion in 2025, with most growth driven by protected brands outside GIP/GLP‑1 agonists and COVID‑19 vaccines and therapeutics.
GIP/GLP‑1 agonists across diabetes and obesity contributed $14 billion in growth, with $9.6 billion concentrated in products approved for obesity and related comorbidities.
COVID‑19 vaccines and therapeutics, which contributed to spending growth in 2024, declined by $4 billion in 2025.
Other evolving issues include artificial intelligence, pharmacy benefit managers, and authorization procedures.
Total net spending on medicines in 2030 is expected to increase by $200 billion compared with 2025, as volume growth and innovation adoption are partly offset by lower‑price drivers such as patent expiries and policy effects.
Over the next five years, medicine spending is projected to grow between 6–9% on a list‑price basis and 4.5–7.5% after discounts, rebates, and other price concessions.
Growth will be driven by the adoption of newly launched innovative products, with an average of 50–55 new medicines expected to launch annually over the next five years, including therapies in oncology, immunology, and other specialty areas, as well as more traditional treatments in diabetes, obesity, and neurology.
Research Brief | U.S. Medicine Use Trends 2026
A concise overview of the latest trends in U.S. medicine use, spending, and patient access in 2025. This video highlights continued growth in prescription use, the impact of innovative therapies such as GIP/GLP-1 agonists, and shifting dynamics across therapy areas and care settings. It also examines persistent affordability and access challenges, including rising out-of-pocket costs, payer restrictions, and evolving insurance design.
Author's Addendum:
Artificial intelligence (LLM) has been touted for the past several years. Although great things are predicted for its use in healthcare, the ultimate outcome is cloudy.
There are thousands of models. Many of the current LLM generation are expensive, and each use requires tokens.
AI model costs vary widely depending on whether you are paying for an end-user subscription or API usage (paying per million tokens).
1. Consumer Subscriptions
Most flagship platforms (e.g., ChatGPT Plus, Claude Pro, Perplexity Pro) share a standard rate of $20/month. Premium models and creative platforms (e.g., Midjourney, Google AI Ultra) range from $30 to $250/month, depending on image limits and advanced reasoning access.
2. API Usage (Pay-per-Token)
For developers and businesses, costs scale with token usage (text chunks). Output tokens typically cost 3 to 8 times more than input tokens:
Budget/Mini Models: (e.g., GPT-4o Mini, DeepSeek V4 Flash, Gemini 2.5 Flash). Rates average $0.15 to $1.00 per million tokens. Ideal for high-volume, simple tasks.
Standard Tier: (e.g., Claude 3.5 Sonnet, GPT-5 series). Rates range from $3 to $15 per million tokens. These offer the best balance of reasoning and cost.
Premium/Reasoning Tier: (e.g., Claude Opus, o1 Pro, Gemini 2.5 Pro). Rates can exceed $20 to $600+ per million tokens. Reserved for highly complex coding or research.
3. Open-Source vs. Proprietary
For large-scale enterprise needs, open-weight models (e.g., Llama 3, Muse Spark) are free to use if you host them yourself, though they require paying for cloud infrastructure like AWS or specialized GPU servers.

No comments:
Post a Comment